
Performance monitoring for single-page applications
Get actionable performance insights and ensure optimal user experience on your single-page apps
Get full insight into end-user performance without page loads
When trying to understand what the user’s real experience was on your website, you must look at technical key indicators like errors and performance perceived during the user’s session. Single page applications (SPA) come with new challenges that need to be mastered.
JavaScript errors are having big impacts and performance metrics need to factor in SPA loading and navigation behavior. Besides these technical factors you need to consider the critical entry- and exit actions. You need to easily compare the overall experience of your users using just mobile browsers but also desktop, tablets or mobile applications or multiple channels.
User Action Duration is Dynatrace’s performance indicator for the User Experience. We can compare the user action duration over all the different channels and can work on getting the experience to the industry best practice.
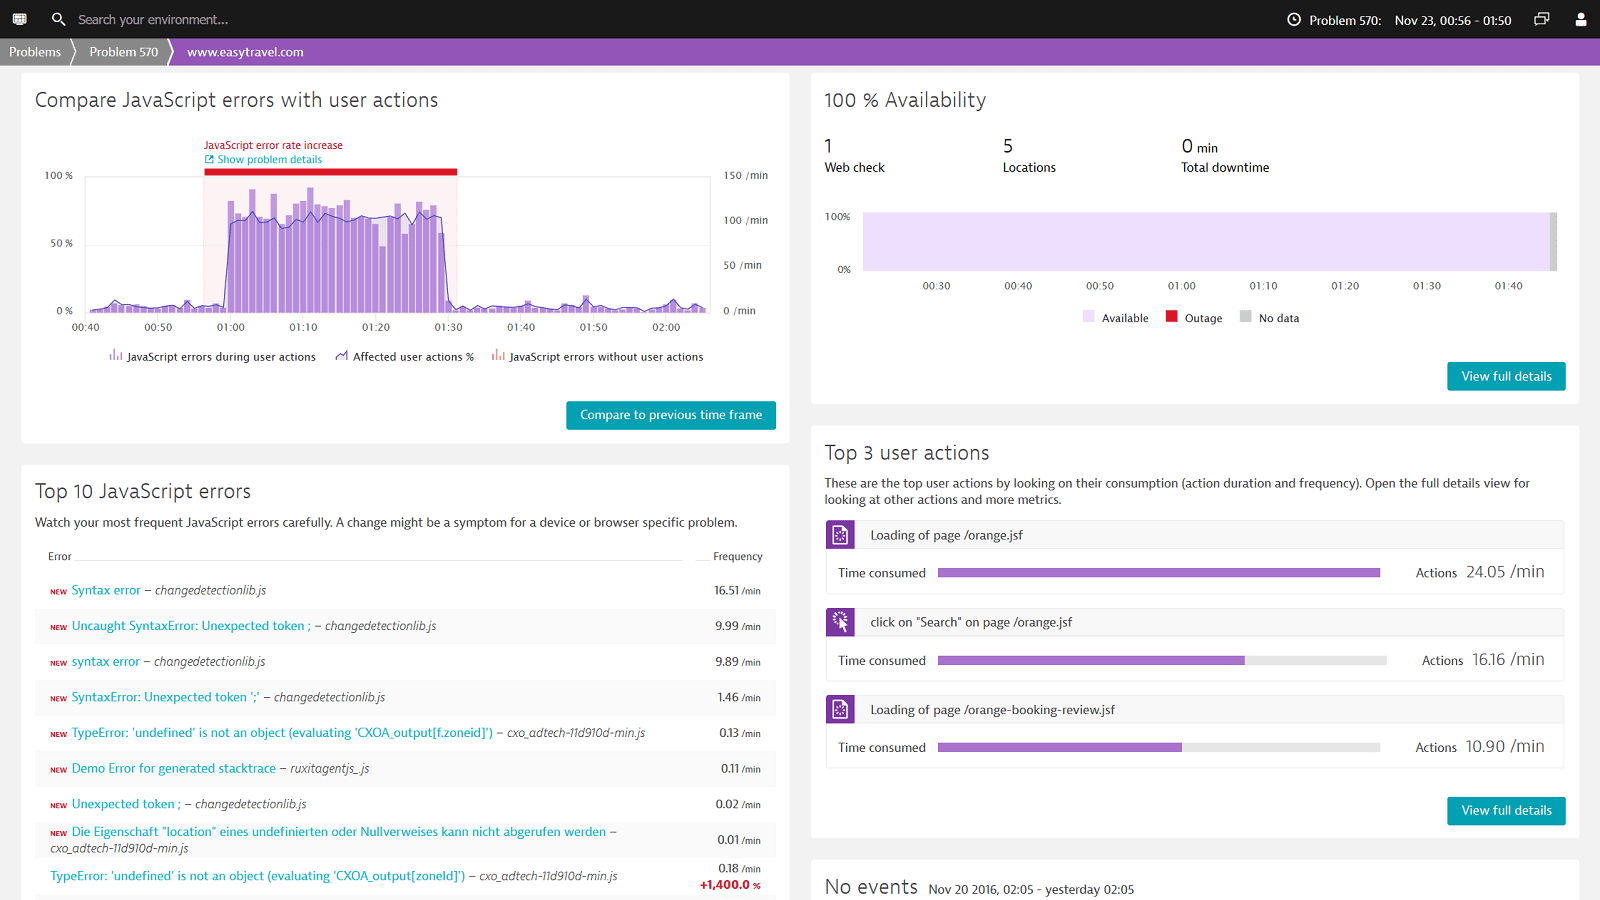
Quickly identify JavaScript errors
JavaScript errors can render the entire SPA unresponsive to the end user.
Especially in the case of single-page apps it is most crucial that you find JavaScript errors quickly; prioritize by those having the biggest impact and fix them before they have a negative impact on the end user performance.
Dynatrace makes it easy to find JavaScript errors and provides line numbers and stack traces which can be used to fix them. On a single infographic you can have an overview of:
- The number of errors for a particular time frame
- The number of user actions being effected by the errors
- The distribution of browsers (with version) on which the end users are experiencing them
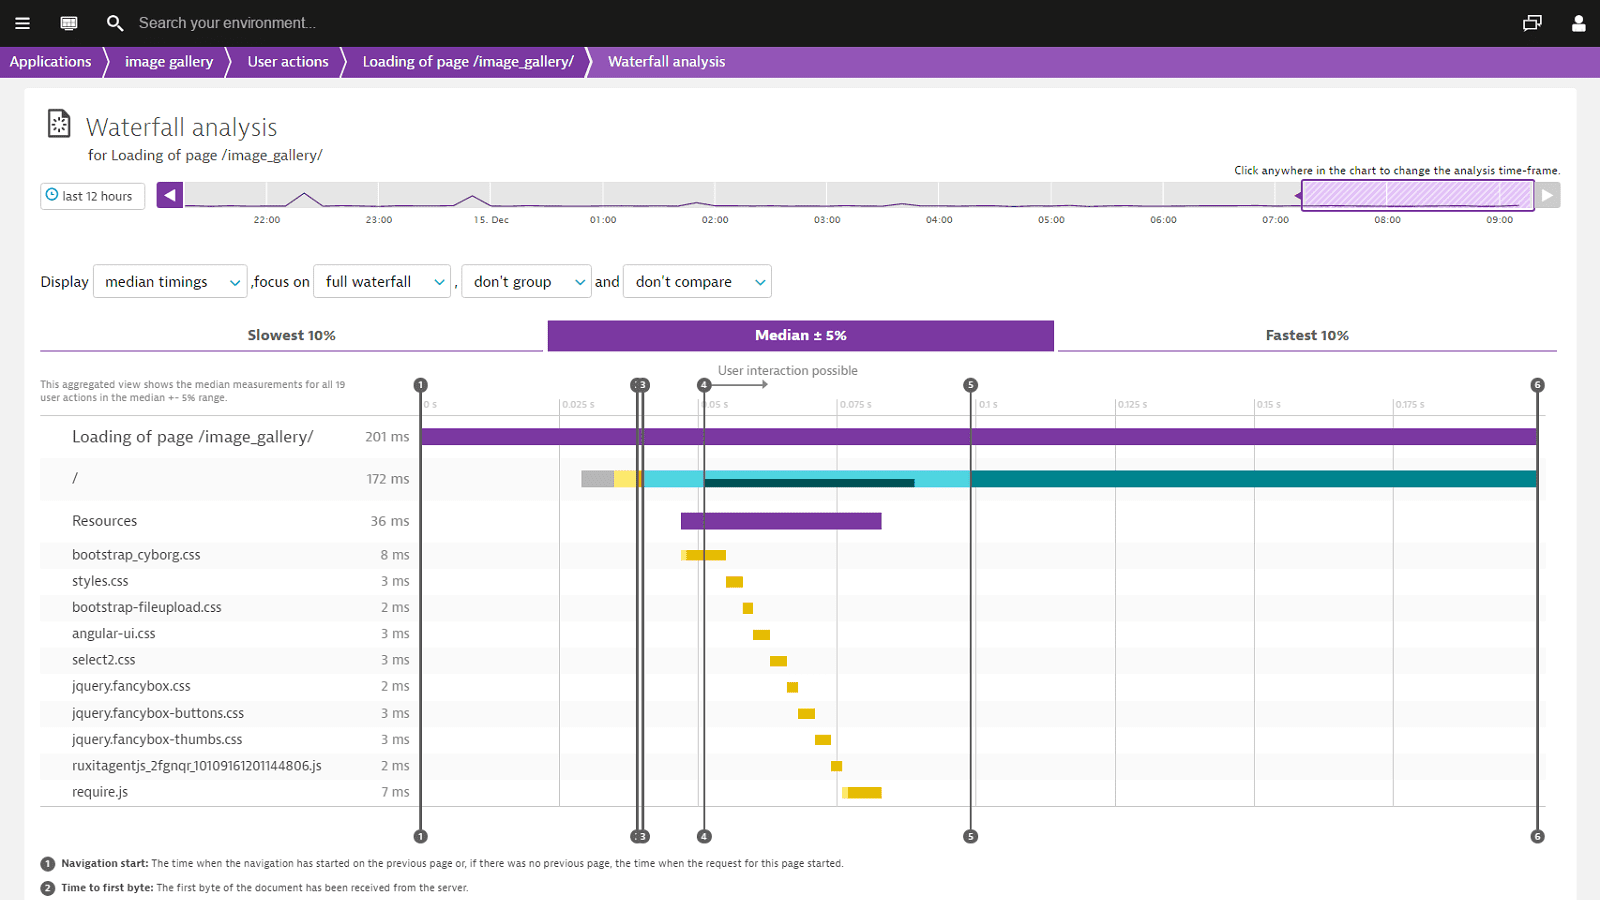
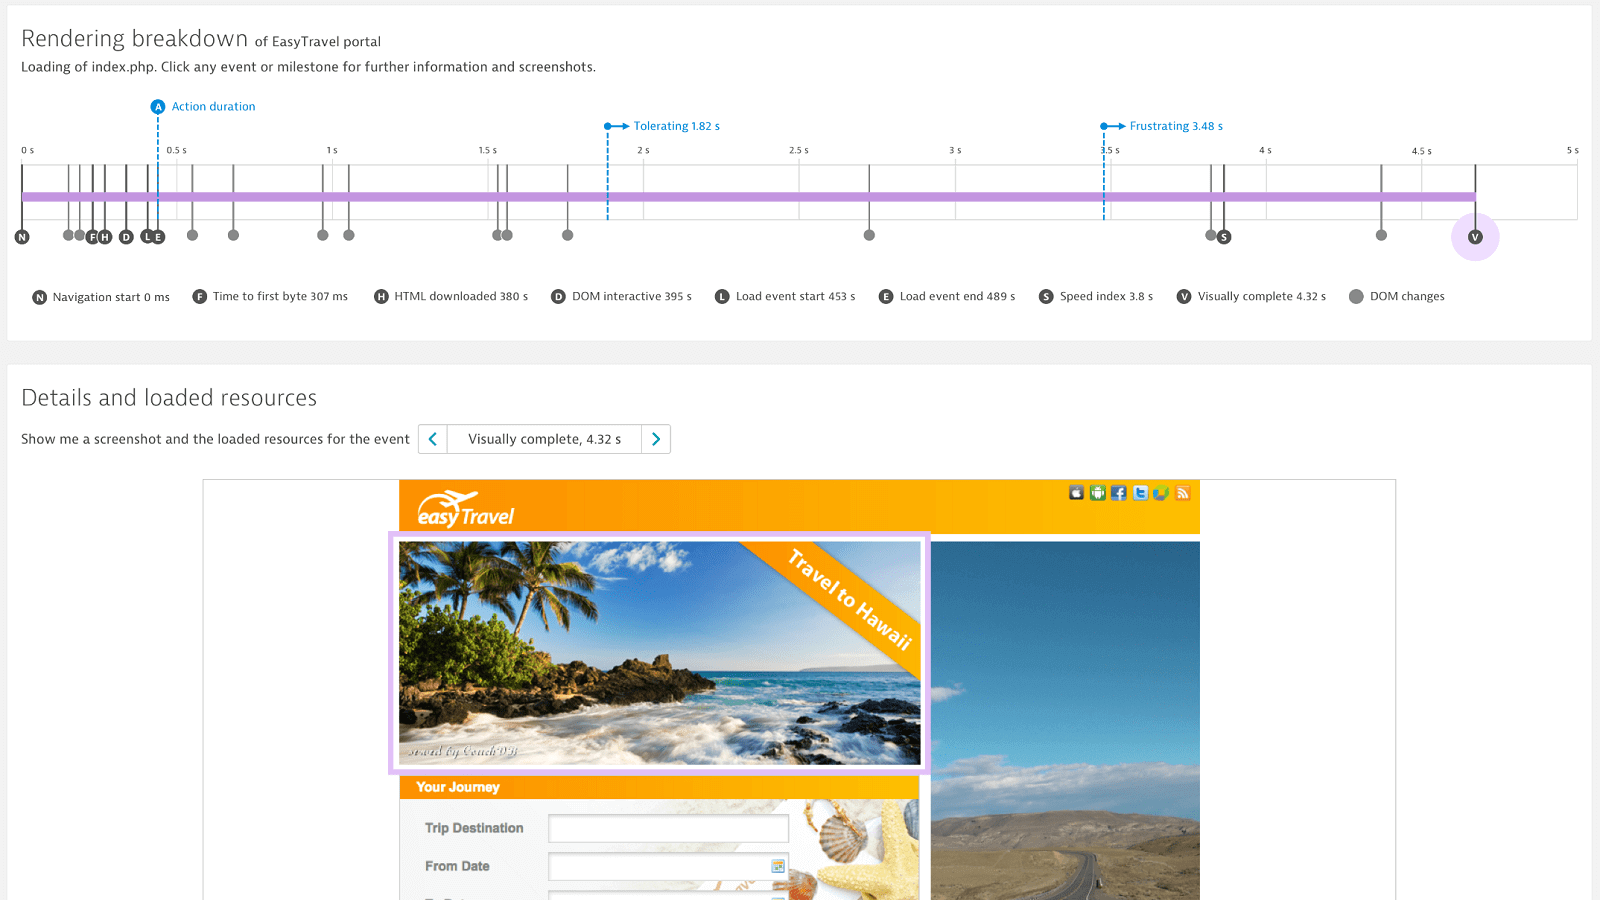
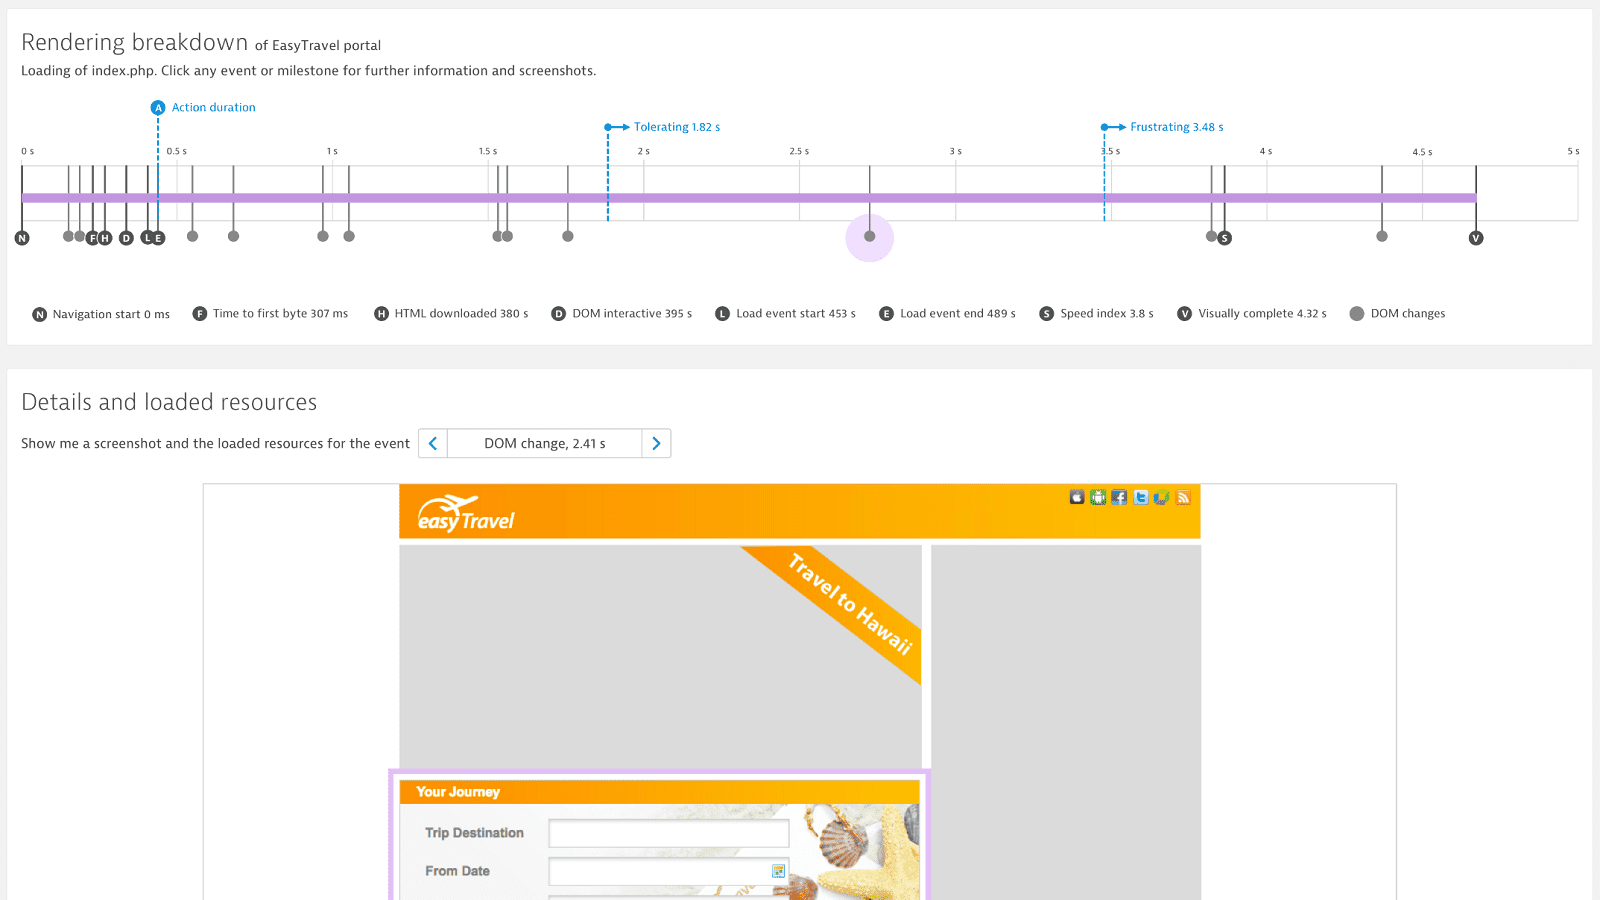
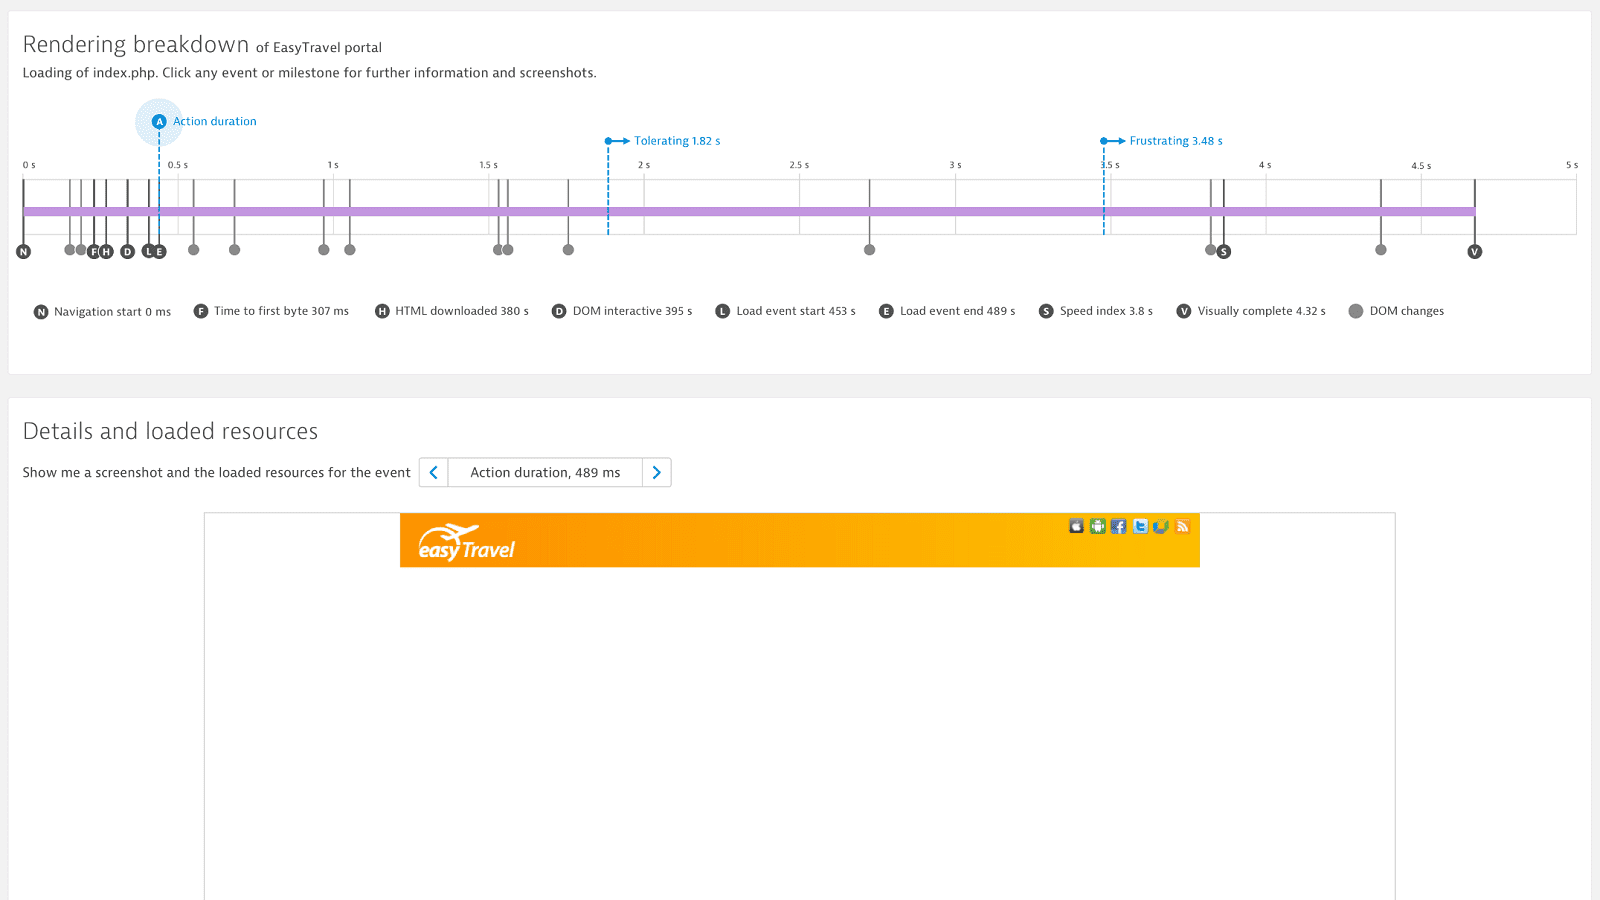
Get meaningful metrics for single page applications
Relying solely on W3C metrics is problematic; especially for single-page applications. Dynatrace Visually complete allows you to assess the real, visual user experience of modern applications. It monitors user experience from application launch to start screen as well as user clicks and screen changes while working with the app.
Monitor your application 24/7 to meet your SLAs
Ensure that your single-page application is available and performs well across 5 continents to meet your SLAs.
- Ensure that your key APIs, web pages and mobile pages perform properly from all customer locations, all the time.
- Analyze data from across the Internet to isolate issues that are "at the edge" all the way to your application hosting environment.
- Dynatrace uses all major desktop and mobile browsers to comprehensively simulate customer journeys from thousands of locations around the world.
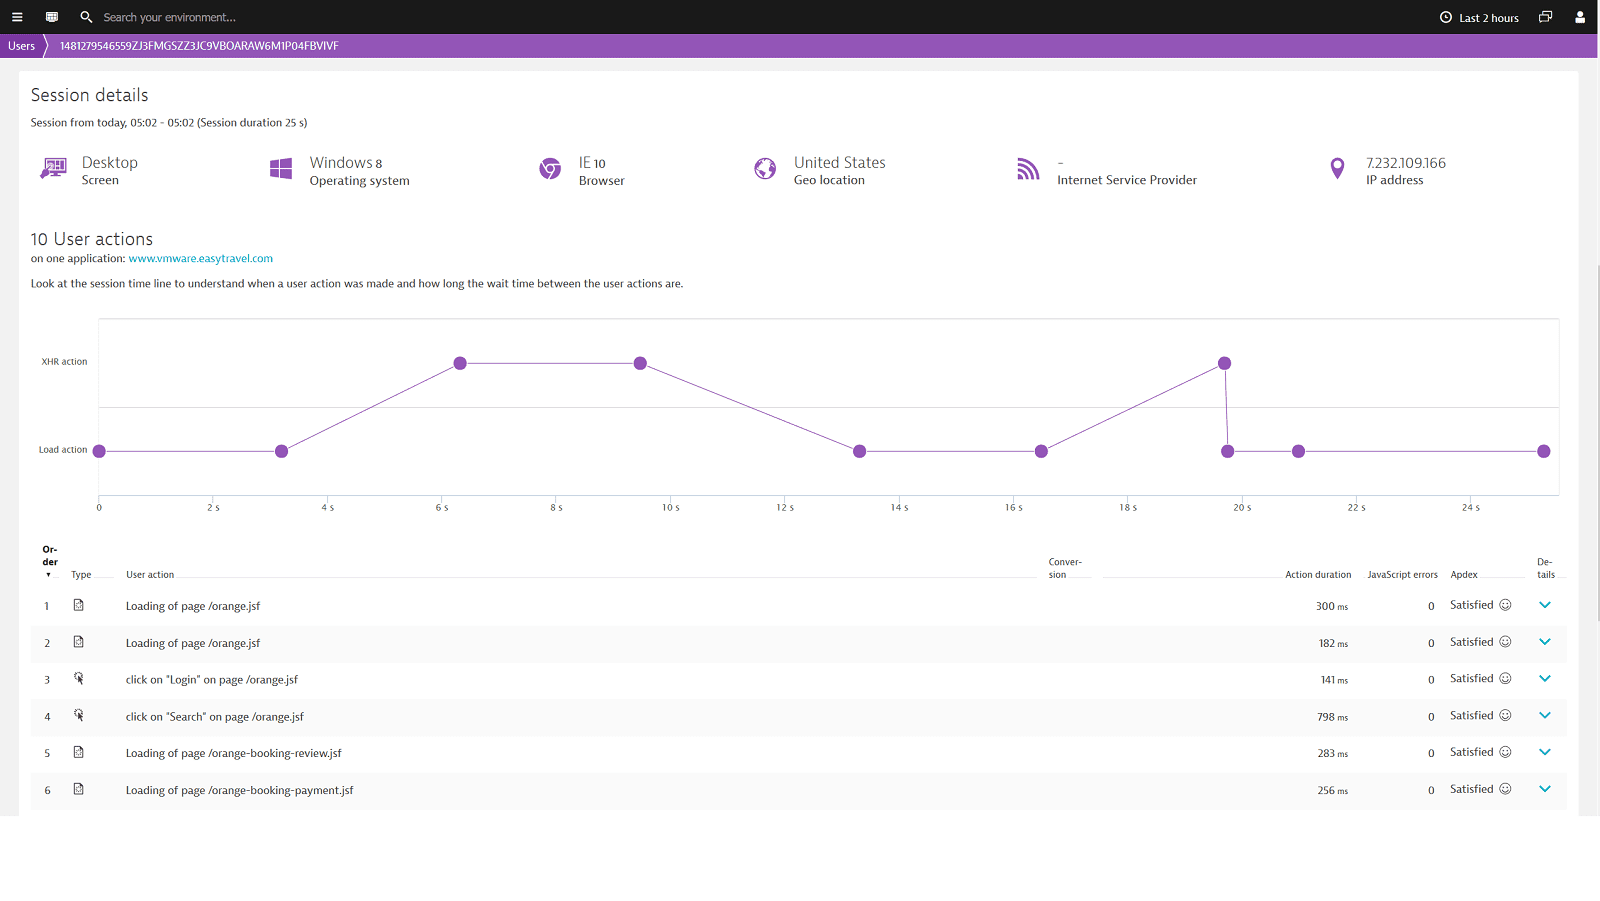
Get full insight into the user journey
When trying to understand what the user’s real experience was on your single-page application, you must look at technical key indicators like errors and performance perceived during the user’s session.
You need to consider the critical entry- and exit actions, as well as to compare the overall experience of your users using only mobile browsers but also desktop, tablets or mobile applications or multiple channels.
User action duration is Dynatrace’s performance indicator for the user experience. We can compare the user action duration over all the different channels.

In today’s retail landscape, it’s imperative to turn website visitors into loyal customers. Dynatrace helps us to quickly understand precisely what we need to do to create a great customer experience that increases our conversions.Kevin McNall Director of Digital Projects and Practices, Rack Room Shoes
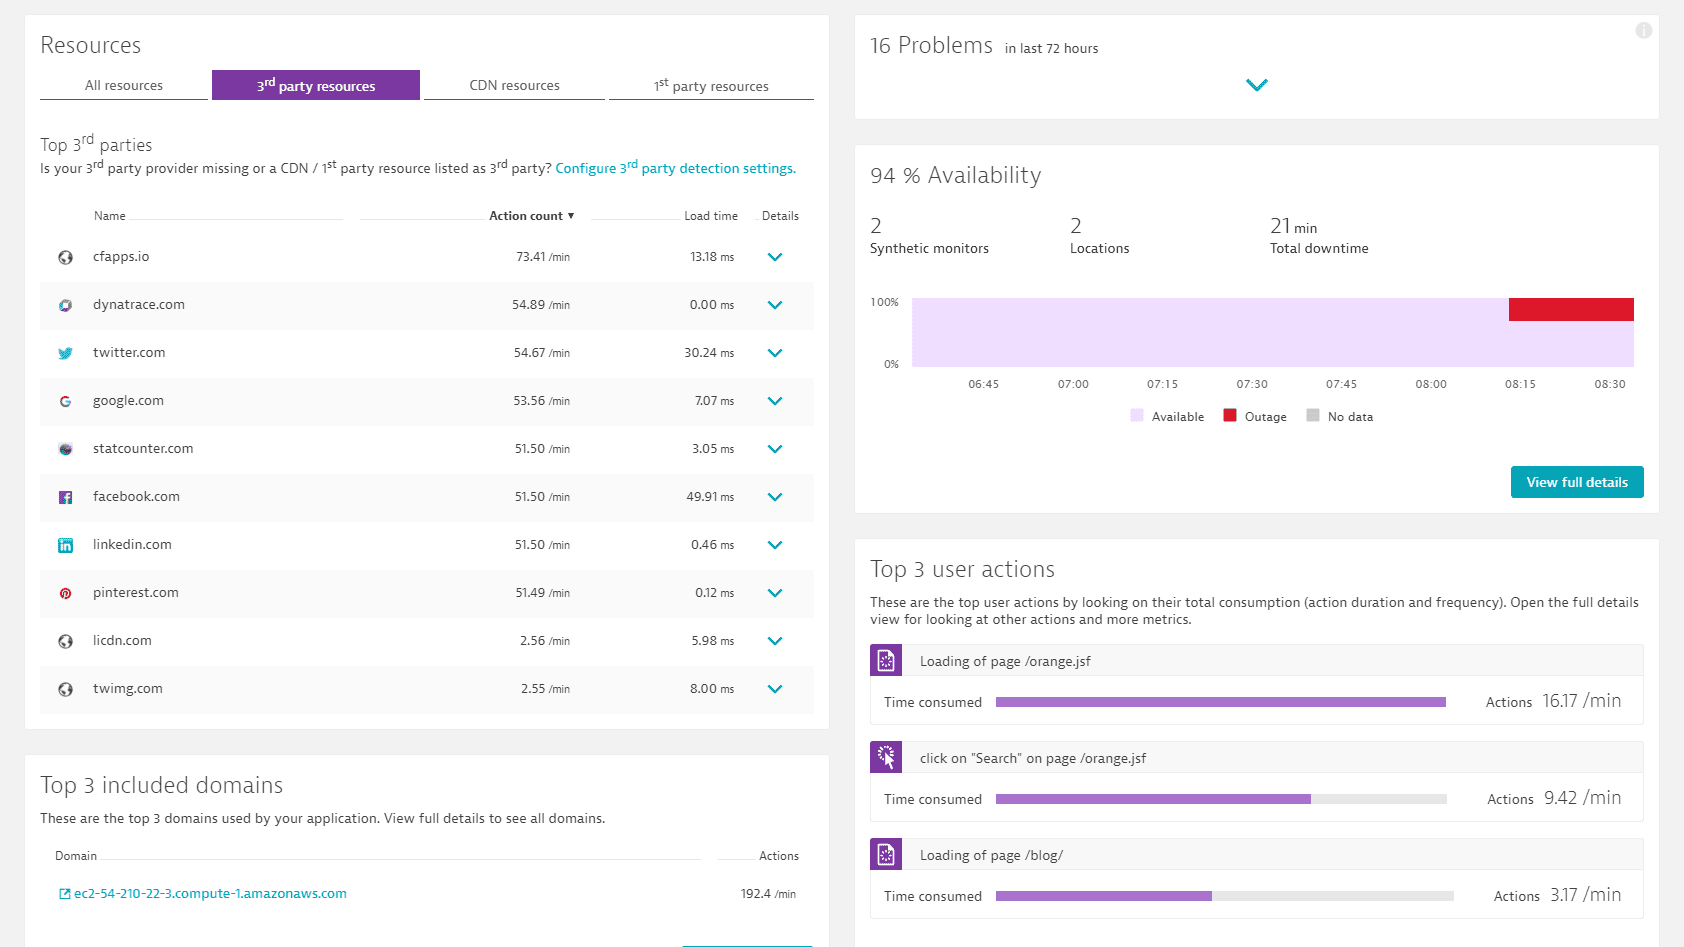
Manage your CDN and Third Party providers
Up to 2/3 of your single-page application content is coming from your Third Party or CDN providers. They have a bigger impact on your applications than your own datacenter. Constantly seeing the errors and performance issues is key to understand the impact of them on your users and business results.
See the performance of your Third Party providers through the lens of your users eye
Watch your providers if they meet their SLAs
Know when in certain regions the performance of your CDN is bad
Ensure optimal user experience on your single-page apps!


A Leader in the 2023 Gartner® Magic Quadrant™ and ranked #1 in the Critical Capabilities for APM and Observability reports
See why we’re positioned furthest for Vision and highest for Execution in the Magic Quadrant, and ranked #1 in all Use Cases in the Critical Capabilities Report for Application Performance Monitoring and Observability.

