
At this year’s STPCon I offered a Performance Clinic for attendees that came to the conference early. As part of this, we did 2 live performance diagnostic sessions: one on a pretty cool 3D visualization app based on Java and JavaScript, another one on a live eCommerce website. On the eCommerce landing page we found the usual performance suspects which were not surprising to me or for the two guys working for that company that were in the room with me. They have tried hard over the last months to highlight these problems to their engineering and business teams but it has always been pushed back due to other priorities.
In this blog I want to re-raise the awareness for very basic WPO (Web Performance Optimization). Whether you use the browser built-in diagnostics tools or extensions such as Firebug, YSlow, PageSpeed or Dynatrace, it doesn’t matter. These tools are available for every developer, web designer and tester and HAVE TO be used as a final sanity check before checking in or releasing code.
Here are some of the highlights we found on the website we analyzed during my performance clinic. We used Dynatrace and analyzed the website on both IE and FF.
1. Key Metrics: Size, # Resources, Load Times
The following shows the Key Performance Indicator (KPI) tab of Dynatrace for loading the home page of that eCommerce website we were analyzing. Easy to see that there is a lot of potential for improvement:
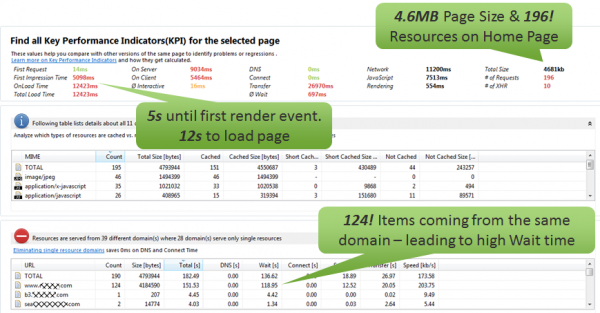
Please remember to follow the basic golden rules of WPO: Reduce Roundtrips, Reduce Content Size, Leverage CDNs, Minify and Merge Content, Use Proper Caching.
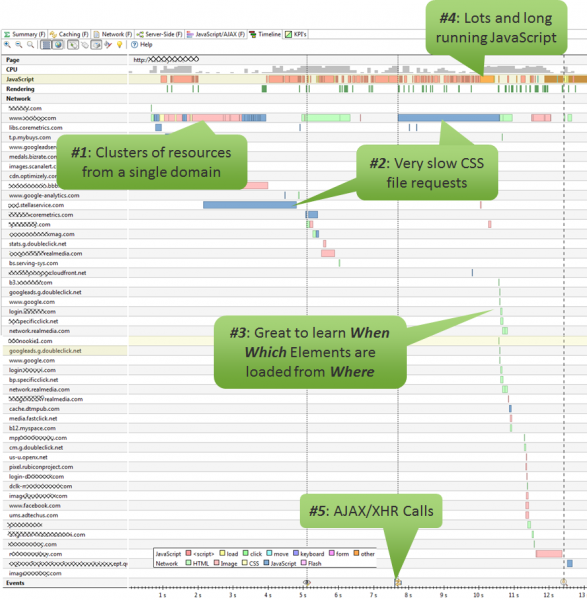
2. Timeline/Waterfall: Learn how your pages are architected
Most every WPO tool out there provides a Timeline or Waterfall Chart. It is great to learn how your page actually gets loaded by the browser. Which resources are depending on each other, how does JavaScript impact page load and how much rendering is going on. For me there are always two main focus areas: Network Waterfall and JavaScript Executions. I always try to spot long running network requests, find “blocks” of network requests coming from the same domain, find visual dependencies between requests as well as looking at long running and excessive JavaScript execution:
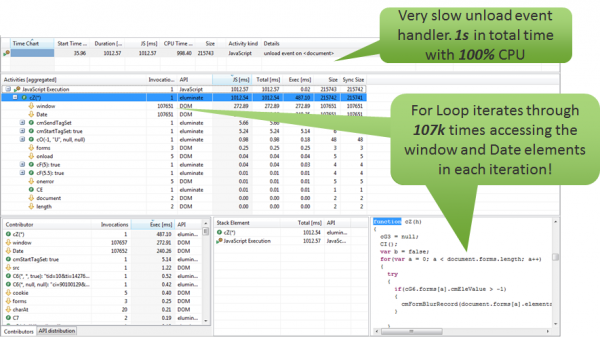
3. JavaScript hotspots
In most web sites JavaScript plays a very important role. As you don’t know how powerful the JavaScript engine is going to be that your users are using it is important to optimize your JavaScript to provide good user experience and performance regardless of the used browser version, OS or underlying hardware. In our case we found a very inefficient for-loop that iterated 107k times in the unload event handler. When somebody navigated from one page to the next this JavaScript code blocked the browser for 1s with 100% CPU utilization. That’s something to optimize:
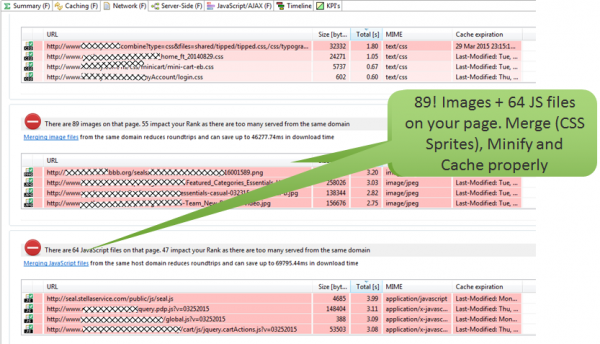
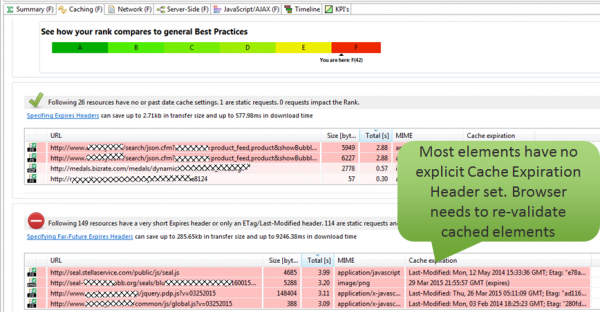
4. Bad Caching and No Merging
Most static content (Images, JavaScript, CSS files) can be cached on the browser so that re-visiting users don’t have to download your company logo, product images or jQuery library every time they visit your page. Another point is merging multiple JavaScript and CSS files together to reduce elements on the page. Both are common techniques to optimize first and revisiting user’s experience with your web sites. Here are two screenshots from Dynatrace that highlight the fact that no good cache headers were used and that some of these files could potentially be merged:
5. Server-Side Performance
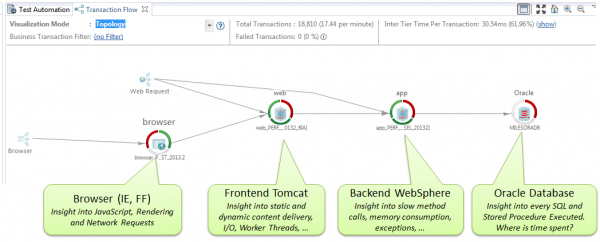
In our Performance Clinic at STPCon, we only analyzed the frontend performance of this website but I learned that these guys are also using an APM tool on the server-side. They confirmed that by using tools such as Dynatrace they also found “The Classics” on the backend: too many database roundtrips, bad server-side coding, multi-threading issues with blocking resources, …
So – this is a shout-out to all of out there to look beyond what’s happening in the browser and use tools such as Dynatrace to also look behind the scenes and watch out for the Top Performance Landmines just as we did in a recent post on End-to-End Analysis of GWT Applications:
Do you see these problems?
Even after years of talking & preaching about Web Performance Optimizations I am still seeing the same basic mistakes almost daily. Maybe I have a good hand in picking the right websites but I am sure the problem is just out there. If you have examples or best practices on how you got yourself or your team to become better with analyzing and preventing these problems let me know and post a comment!


Looking for answers?
Start a new discussion or ask for help in our Q&A forum.
Go to forum