
Whenever there is bad press coverage of Node.js, it is (typically) related to performance problems. This does not mean that Node.js is more prone to problems than other technologies – the user must simply be aware of certain things about how Node.js works. While this technology has a rather flat learning curve, the machinery that keeps Node.js ticking is quite complex and you must understand it to preemptively avoid performance pitfalls. And if things go wrong you need to know how to fix things fast.
In this post, I’ll cover how Node.js manages memory and how to trace down memory-related problems. Unlike platforms like PHP, Node.js applications are long-running processes. While this has lots of positive implications such as allowing database connections to be set up once and then reused for all requests, this may also cause problems. But first, let’s cover some Node.js basics.

Node.js is a C++ program controlled via V8 JavaScript
Google V8 is a JavaScript engine initially created for Google Chrome but it can also be used as a standalone. This makes it the perfect fit for Node.js, and it is the only part of the platform that actually ‘understands’ JavaScript. V8 compiles JavaScript down to native code and executes it. During execution it manages the allocation and freeing of memory as needed. This means that if we talk about memory management in Node.js we actually always talk about V8.
Please read on here for a simple example on how to use V8 from a C++ perspective.
V8’s Memory Scheme
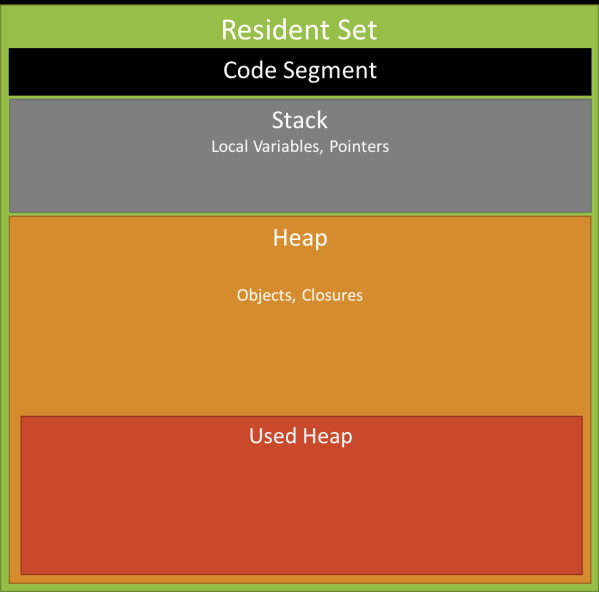
A running program is always represented through some space allocated in memory. This space is called Resident Set. V8 uses a scheme similar the Java Virtual Machine and divides the memory into segments:
- Code: the actual code being executed
- Stack: contains all value types (primitives like integer or Boolean) with pointers referencing objects on the heap and pointers defining the control flow of the program
- Heap: a memory segment dedicated to storing reference types like objects, strings, and closures.
Within Node.js the current memory usage can easily be queried by calling process.memoryUsage().
This function will return an object containing:
- Resident Set Size
- Total Size of the Heap
- Heap actually Used
We can use this function to record the memory usage over time to create a graph that perfectly shows how V8’s memory handling actually works.
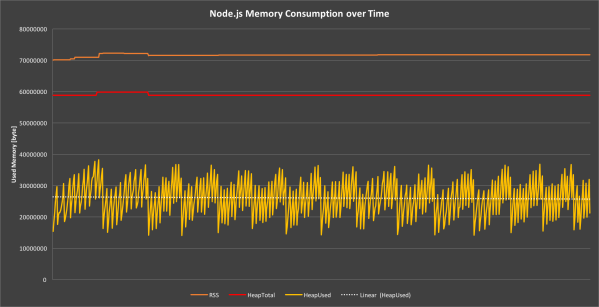
We see that the used heap graph is highly volatile but always stays within certain boundaries to keep the median consumption constant. The mechanism that allocates and frees heap memory is called garbage collection.
Enter Garbage Collection
Every program that consumes memory requires a mechanism for reserving and freeing space. In C and C++, this is accomplished by malloc() and free() as the example below shows.
char * buffer;

buffer = (char*) malloc (42);


// Do something with buffer

free (buffer);
We see that the programmer is responsible for freeing heap memory that is no longer required. If a program allocates memory that is never freed the heap will constantly grow until the usable memory is exhausted, causing the program to crash. We call this a memory leak.
As we already learned, in Node.js, JavaScript is compiled to native code by V8. The resulting native data structures don’t have much to do with their original representation and are solely managed by V8. This means that we can’t actively allocate or deallocate memory in JavaScript. V8 uses a well-known mechanism called garbage collection to address this problem.
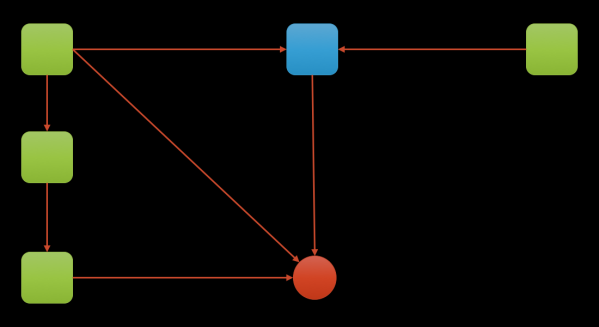
The theory behind garbage collection is quite simple: If a memory segment is not referenced from anywhere, we can assume that it is not used and, therefore, can be freed. However, retrieving and maintaining this information is quite complex as there may be chained references and indirections that form a complex graph structure.
Garbage collection is a rather costly process because it interrupts the execution of an application, which naturally impacts its performance. To remedy this situation V8 uses two types of garbage collection:
- Scavenge, which is fast but incomplete
- Mark-Sweep, which is relatively slow but frees all non-referenced memory
For an excellent blog post containing in-depth information about garbage collection in V8 please click here.
Revisiting the data we collected from process.memoryUsage() we can now easily identify the different garbage collection types: The saw-tooth pattern is created by Scavenge runs and the downward jumps indicate Mark-Sweep operations.
By using the native module node-gc-profiler we can gather even more information about garbage collection runs. The module subscribes to garbage collection events fired by V8, and exposes them to JavaScript.
The object returned indicates the type of garbage collection and the duration. Again, we can easily graph this to gain a better understanding of how things work.
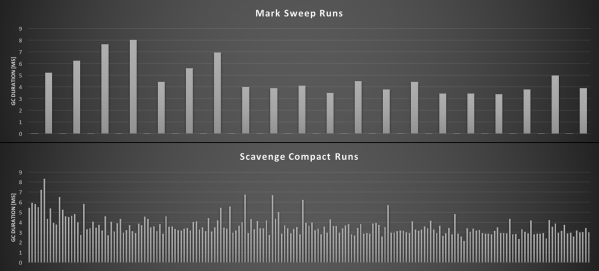
We can see that Scavenge Compact runs at a much higher frequency than Mark-Sweep. Depending on the complexity of an application, the durations will vary. Interestingly the above chart also shows frequent, very short, Mark-Sweep runs, the function of which I have yet determined.
When things go wrong
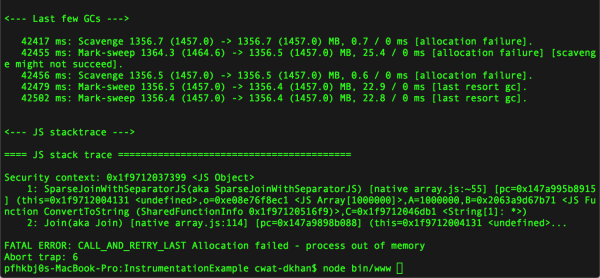
So if garbage collection cleans up the memory, why do you have to care at all? In fact, it is still possible — and easy — to introduce memory leaks that suddenly appear in your logs.
Employing our previously introduced charting we can even watch the memory piling up!
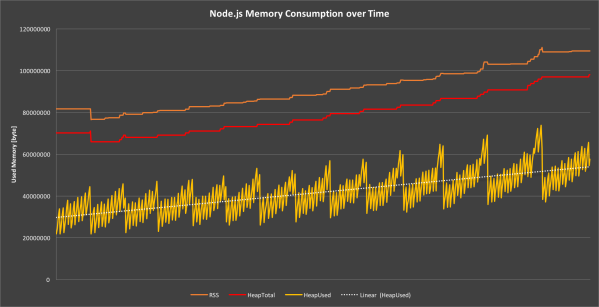
Garbage collection tries its best to free memory but for every run, we see that consumption after a garbage collection run is constantly climbing, which is a clear indication of a leak. While these metrics are apparently a great starting point for anomaly detection, let’s review how to build a leak first before discussing how to trace it down.
Building a Memory Leak
Some leaks are obvious — like storing data in process-global variables, an example of which would be storing the IP of every visiting user in an array. Others are more subtle like the famous Walmart memory leak that was caused by a tiny missing statement within Node.js core code, and which took weeks to track down.
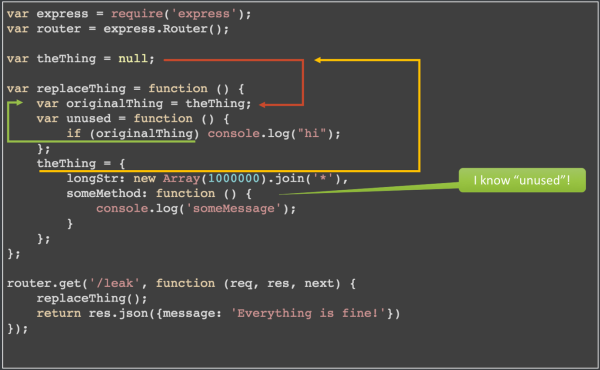
This looks OK at first glance. We could think that theThing gets overwritten with every invocation of replaceThing(). The problem is that someMethod has its enclosing scope as context. This means that unused() is known within someMethod() and even if unused() is never invocated, it prevents the garbage collector from freeing originalThing. There are simply too many indirections to follow. This is not a bug in your code, but it will cause a memory leak that is difficult to track down.
So wouldn’t it be great if we could have a look into our heap to see what’s currently in there? Fortunately, we can! V8 provides a way to dump the current heap, and V8-profiler exposes this functionality to JavaScript.
/**

 * Simple userland heapdump generator using v8-profiler

 * Usage: require('[path_to]/HeapDump').init('datadir')
 *
 * @module HeapDump
 * @type {exports}
 */

var fs = require('fs');
var profiler = require('v8-profiler');
var _datadir = null;
var nextMBThreshold = 0;


/**
 * Init and scheule heap dump runs
 *
 * @param datadir Folder to save the data to
 */
module.exports.init = function (datadir) {
    _datadir = datadir;
    setInterval(tickHeapDump, 500);
};

/**
 * Schedule a heapdump by the end of next tick
 */
function tickHeapDump() {
    setImmediate(function () {
        heapDump();
    });
}

/**
 * Creates a heap dump if the currently memory threshold is exceeded
 */
function heapDump() {
    var memMB = process.memoryUsage().rss / 1048576;

    console.log(memMB + '>' + nextMBThreshold);

    if (memMB > nextMBThreshold) {
        console.log('Current memory usage: %j', process.memoryUsage());
        nextMBThreshold += 50;
        var snap = profiler.takeSnapshot('profile');
        saveHeapSnapshot(snap, _datadir);
    }
}

/**
 * Saves a given snapshot
 *
 * @param snapshot Snapshot object
 * @param datadir Location to save to
 */
function saveHeapSnapshot(snapshot, datadir) {
    var buffer = '';
    var stamp = Date.now();
    snapshot.serialize(
        function iterator(data, length) {
            buffer += data;
        }, function complete() {

            var name = stamp + '.heapsnapshot';
            fs.writeFile(datadir + '/' + name , buffer, function () {
                console.log('Heap snapshot written to ' + name);
            });
        }
    );
}
This simple module creates heap dump files if memory usage is constantly rising. Yes, there are more sophisticated approaches to detect anomalies but — for our purpose — this should be sufficient. If there is a memory leak you may end up with a significant number of such files. So you should monitor this closely and add some alerting capabilities to that module. The same heap dump functionality is also provided within Chrome and, fortunately, you can use Chrome developer tools to analyze the dumps V8-profiler.
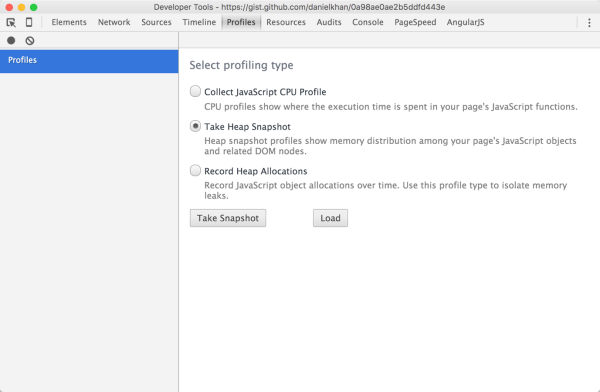
One heap dump may not help you because it won’t show you how the heap develops over time. That’s why Chrome developer tools allow you to compare different memory profiles. By comparing two dumps we get delta values that indicate which structures grew between two dumps as seen below.
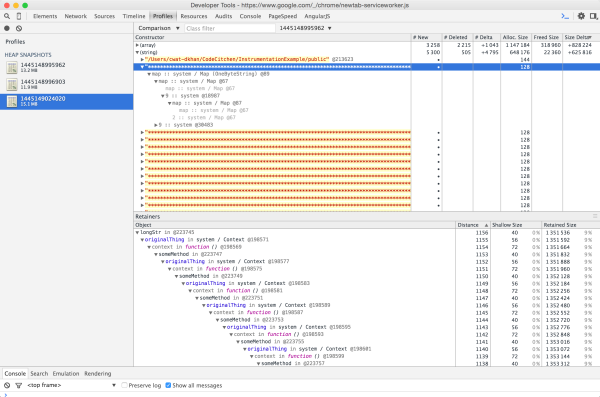
And here we have our problem. A variable called longStr contains a string of asterisks and is referenced by originalThing, which is referenced by some method, which is referenced by…well, you get the point. There is a long path of nested references and closure contexts that prevent longStr from being freed anytime soon.
Although this example leads to obvious results the process is always the same:
- Create heap dumps with some time and a fair amount of memory allocation in between
- Compare a few dumps to find out what’s growing
Wrap Up
As we have seen, garbage collection is a complex process and even valid code can cause memory leaks. By using the out-of-the-box functionality provided by V8 plus Chrome developer tools, it’s possible to obtain insights that help us trace down the root cause of the leaks and, if you build in such functionality into your application, you have everything necessary to fix a problem when it occurs.
But one question remains: How can we fix this leak? This answer is simple – just add theThing = null; add the end of the function, and your day is saved.
Node.js and Dynatrace
To see the big picture, including which transactions are passing through your node application, you may want to use Dynatrace. We provide a Node.js agent that will, in conjunction with the various other supported technologies, help you understand your application as a whole.
This blog post is part of my ongoing research on instrumenting Node.js, and some of the tools introduced here are already in our product or will be incorporated into it soon.
Sign up now for 15 days of free Node.js monitoring. You’ll be up and running in under 5 minutes: Sign up, deploy our agent and get unmatched insights out-of-the-box.


Looking for answers?
Start a new discussion or ask for help in our Q&A forum.
Go to forum