
Is it possible to speed up a complex Java application by more than 10% in a few simple steps without changing code? Yes, if you configure your Java VM correctly.
One of the most resource-intensive components of a Java VM is the garbage collector (GC) which automatically reclaims unreferenced objects and makes their memory available for further allocation. With millions of objects to be reclaimed at a time, your application may stutter or even pause for a few seconds while the heap is cleaned up. What can you do about this problem?
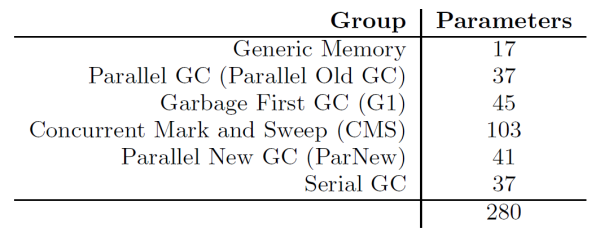
Five garbage collectors, 280 parameters
The HotSpot VM comes with several garbage collectors for different workloads. Each of these has hundreds of parameters that can be tweaked in different ways to adapt the garbage collector to your application’s memory profile. But who understands what all these parameters really mean? In most cases they refer to VM internals that tell users little to nothing. Thus, armies of system administrators struggle to find the optimum configurations following a trial and error approach—often in vain.
In a joint research project with the Johannes Kepler University (JKU) in Linz, Austria, Dynatrace found a way to automatically determine near-optimal garbage-collector configuration for a specific workload. The idea is simple: Run your application using certain GC parameter settings and measure the GC time. Then, slightly modify one or more parameters and measure again. If the GC time has improved, the settings are retained, otherwise they are discarded. In this way, you can learn the optimal GC settings by experimenting with randomly-selected changes. Of course this process should be automated so that the modifications don’t have to be performed manually.The number of GC-related parameters in Java 8 is overwhelming
Hill Climbing
This technique, called “hill climbing,” is well-known in the AI community. It strives to find the optimum (i.e., the “top of a hill”) by walking a multi-dimensional parameter space and going “upward” as long as possible. In order not to become trapped in a local optimum, the algorithm applies larger parameter changes from time to time to see if improvements can be achieved elsewhere. We used a special implementation of hill climbing called ParamILS by Hutter et al.
In a case study, Dynatrace applied this technique to one of their own servers using a workload that brings the server to its limits by making it process an exceptionally large number of requests. After measuring the throughput (i.e., the maximum number of requests that can be processed) the GC parameters are automatically modified using the hill climbing technique until optimal throughput is achieved. In this particular case the throughput was improved by 14%!
Garbage First GC applied to SPECjbb
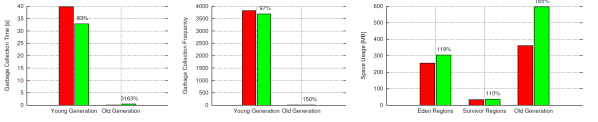
When running the SPECjbb benchmark with Garbage First GC, measurements have shown that, although many objects die young, the average object age at death is considerably higher than in other benchmarks, like xalan. The figure shows the GC time and the GC frequency per generation as well as the heap space usages. It turned out that the default parameter con figuration kept almost all objects in the young generation. However, tenuring long-living objects earlier would decrease the GC time of the young generation at the expense of the old generation. The optimized con figuration has found the sweet spot, or at least an approximation of it, for the object distribution between generations.
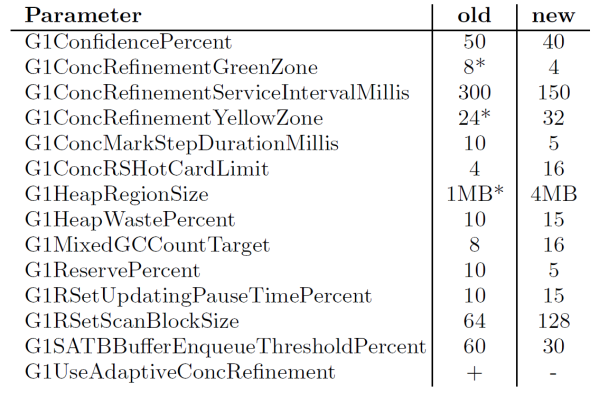
This table compares the optimized parameter values with their default values for the SPECjbb benchmark. For full insight into the results, please refer to The Taming of the Shrew: Increasing Performance by Automatic Parameter Tuning for Java Garbage Collectors by Philipp Lengauer and Hanspeter Mössenböck of Johannes Kepler University.
Your mileage?
Is it also possible to optimize GC parameters for customer applications? Yes! You just need to download the optimizer provided by Dynatrace as well as a small configuration file that describes the available parameters and their possible values. Such configuration files already exist for most garbage collectors of the HotSpot VM. The optimizer as well as a user guide can be downloaded for free.
Dynatrace puts tremendous effort into research and innovation. In cooperation with Johannes Kepler University’s Christian Doppler Laboratory, which focuses on the monitoring and evolution of large-scale software systems, Dynatrace has developed tools and techniques that enable you to monitor the memory behavior of your Java applications (i.e., object allocations and GC activity) on the VM level. In this way, you’re supported in finding Java performance bottlenecks and memory leaks in your Java applications.
More details about Java garbage-collector optimization will be explained in upcoming blog posts.


Looking for answers?
Start a new discussion or ask for help in our Q&A forum.
Go to forum